Candlelight Computers

Ideas from an average guy

In a society run by money we're creating a culture of waste and pollution. We need to step back and then step carefully to do what is best for the future of humanity. We need to work together, and create a transparent world run by the truth of raw data. Follow us if you care about “right to repair” or mfg sustainability; the art of repairing and upgrading rather than trashing. This is a blog about how we can work with our world with a focus on programming , robotics, materials and sustainability. 

Filtering by Category: Investigation

Python debugger(pdb) ; tldr pdb parse issue (invalid characters even in comments) solved by inverting a search on basic character set

Question: why 'utf-8' codec can't decode byte often appears when running pdb

Question: Why 'utf-8' codec can't decode byte often appears when running pdb on some script

pdb.set_trace()

or running

pdb.pm()

after a fail

Why 'utf-8' codec can't decode byte often appears when running pdb

Recently I came across a very strange issue with pdb that had my wheels spinning for a while.
Now that I finally figured out what was going on, figure I will share.

Up until this year I have never see this issue, and now I see it constantly, and it really interferes with my debugging. I had mostly seen it in the past after some script had failed and raised some exception, then I would try my luck with `pdb.pm()` and sometimes it would return something weird like the below... at the time I assumed it was something weird/buggy about the script itself... but now I have seen this many times when i do not expect it, and now it popped up in a script I own, and I need to understand The error looks like this `


import pdb; pdb.set_trace()
  File "C:\Python38\lib\bdb.py", line 88, in trace_dispatch
    return self.dispatch_line(frame)
  File "C:\Python38\lib\bdb.py", line 112, in dispatch_line
    self.user_line(frame)
  File "C:\Python38\lib\pdb.py", line 262, in user_line
    self.interaction(frame, None)
  File "C:\Python38\lib\pdb.py", line 356, in interaction
    self.print_stack_entry(self.stack[self.curindex])
  File "C:\Python38\lib\pdb.py", line 1460, in print_stack_entry
    self.format_stack_entry(frame_lineno, prompt_prefix))
  File "C:\Python38\lib\bdb.py", line 556, in format_stack_entry
    line = linecache.getline(filename, lineno, frame.f_globals)
  File "C:\Python38\lib\linecache.py", line 16, in getline
    lines = getlines(filename, module_globals)
  File "C:\Python38\lib\linecache.py", line 47, in getlines
    return updatecache(filename, module_globals)
  File "C:\Python38\lib\linecache.py", line 137, in updatecache
    lines = fp.readlines()
  File "C:\Python38\lib\codecs.py", line 322, in decode
    (result, consumed) = self._buffer_decode(data, self.errors, final)
UnicodeDecodeError: 'utf-8' codec can't decode byte 0x91 in position 3603: invalid start byte


I have now seen this in many different code set. When it happened just now the code in question was running without fail... I just added a pdb.set_trace() call and then I see the failure.

Maybe there is some invalid character in the file? or pdb is trying to parse docstrings and a path inside is creating some kind of backslash char which pdb is trying to interpret as a char?


First I moved set_trace call to first line of execution and got same error…
I'm familiar with \x012 sort of numbers, but nothing like that in my code…
added another slash if there was just one (ie. path=r"C:\test\file.csv" -> path:r"C:\\test\\file.csv") …

When none of this changed the issue I just started deleting huge portions of the file; since pdb is now first line of code it won’t matter when I delete last quarter of file…
and it runs! Ah-hah. Now we’re getting somewhere… One way is to binary search the file… Deleting smaller and smaller segments till the character is question has been isolated… But that sounds rather tedious…

I sit there very confused, and wonder why pdb would not give me a better error code if it was really just a matter of some invalid char hiding somewhere in the file... why does it not at least point out to me what are some of the preceding chars, or give me better detail how to address the problem.

Oh, like normal when reading errors the first time, I missed was what python was trying to tell me.

position 3603


I’m using vim and wondered how could we have gotten here sooner?

I read we can use
:goto 3603
to go to the correct byte… but looks like maybe PDB is ignoring certain chars because the goto doesn’t take me to the correct location.


My favorite way I found was a simple search criteria, to search for any non ascii characters.

/[^\x00-\x7F]

using this basic search in vim will allow you to find any characters which are not allowed in the pdb character parse set. If you are not familiar with the terms I can breifly explain

/ search
[ set
^ invert set
\x00 character id 0
- automatic range
\x7F last char of ascii set
] end set

Probably this came from copying part of a document since it was in the comments, but note it could occur if you had copied code from some modern corporate communications editor (using another character encoding). Since the python interpreter didn’t seem to have any issue with the chars, but only PDB parser, you may not even notice when the stray quotation mark is introduced.

Thanks for reading.
Hope you learned something!

Analysis of RasbPi Clocks

The actual chip under scrutiny is the Atmega 168/328 timer


According to docs Pwm exists on pairs [5, 6], [3, 9], [10, 11]

Upon investigation a 6ns offset occurs from measuring unmatched signals because the physical groups are actually [9,10], [3,11], and [5,6]


According to https://playground.arduino.cc/Code/PwmFrequency

5 and 6 @ 62500 Hz 3, 9, 10, 11 @ 31250 Hz

However on the analogWrite page it claims output 5,6 @ 980 Hz. I’m uniquely suited to find out what the clock speeds are at various settings, take images of how the pwm is actually occurring, what the waveforms look like, and detail some physical characteristics are of the signal.


In what is certainly overkill for this project I’ll be using the Agilent infinium DSA-92504A

and measuring with a TEK P6139A Voltage Probe (500MHz, 8pF, 10 MOhm 10X, 1.3 m)

These are differential probes, and I’ll be using ground as reference


(Thumb of setup) Assume that all connections are terminated in 50 Ohm


So, first things first, we should have 2 different clock rates between [5,6] and [3,9,10,11] so let’s check that by probing 5 and 11. Visually we can see they differ by ABOUT a factor of 2, but it’s not quite that perfect and since the difference is not an integer number (or not a clean clock) the signals are not in sync. If they are indeed designed to be exactly a factor of 2 apart there must be some periodic Jitter (PJ) keeping the signals from lining up consistently (got lucky in this screenshot)

5,11@duty cycle_126-255.PNG

I want to know if the clocks which are the same frequency pins (5,6 in this case) are in sync. The pairs all look generally like below.They seem to be very close, but with this equipment I can see differences of a few picoseconds, but we’ll dig into that in a minute by zooming into the signals.

5,6@duty cycle_1-2_.PNG

It looks like they always stay synced at all times.

Lets move on from 50% duty cycle and check out what the min period of the duty cycle is, so I change the duty cycle to the minimum value 1/255 At this point the signals become 0.39% active and since the clocks at different frequencies will trigger at different times I have to do them one at a time. So in the screenshot just for pin 11

11 at duty cycle_1divBy255_percent.PNG


we can see the pulse lasts about 8 micro sec. If we assume this is the minimum toggle time for the signal, this is the clock speed. Taking the duration of the pulse as one clock cycle results in a freq of ABOUT 125kHz= 1 / 8e-6s. Hmm. That's about twice the speed that this clock should be.

As it turns out it’s not quite that simple. We’re being limited by the analogWrite interface to only 1/225 resolution. When I measure the other signals [5,6] it also measures in at 8 us which makes given the resolution limit of the interface.


When I zoom there is no skew/lag between them, and when I REALLY zoom I start to see some interesting variations.

10b,11gWall power@150-255duty.PNG
10b,11g_wallPower_Zoom_overlay.PNG


I’ve not mentioned amplitude yet, but it bears noting that HIGH is 5.55mV and a low is ~2.4mV, so it’s really interesting to me how the start of the “high” segment is prefaced with a 200mV overshoot. This must be a signal (from what to what)l to start, because it seems ridiculous as an overshoot value of 40 times greater than the typical level.  It’s probably also worth noting that the power is coming from a laptop, and there may be some noise associated with that as well. Let’s use wall power instead just in case.


Now on wall power and back to pins [10,11] to investigate the signal properties of  this 6us offset that doesn’t exist on the [9,3] or [5,6] lines. I decided to get a screenshot of the voltage artifacts suggesting that the signals are on related circuits. It’s hard to tell what the signal is here because we are so zoomed out to be able to see the spike, but this is 6ms into the signal. Where green is transitioning to an on state. Even tho the blue signal has already been outputting, there is still a lot of noise (and bounce) caused by the signal.

10b,11gWall power@150-255duty_Zoom.PNG


First we’ll look where the blue signal (pin 10) where the duty cycle begins with a 175 mv peak and then settles back to normal high state voltage of 6mV in about 50ns.

It’s really interesting to me how the green signal of pin 9 responds to this impulse. It peaks at about 22 mV and eventually settles back to it’s low level.


Now onto where the green signal (pin 11) begins transmitting power, it peaks at 150mV and settles in a bit less than 50ns. The signal itself is very irregular looking. So let’s check it out


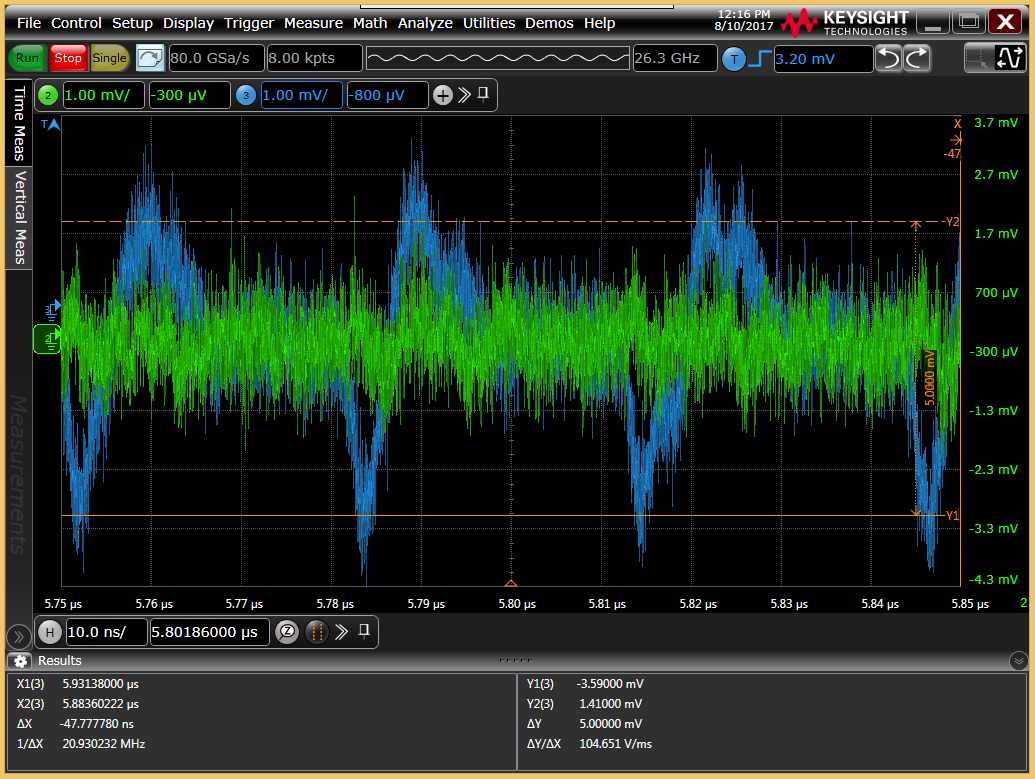
Here the cursors are set to show voltage peaks (dY= 7mv)


Here i’m showing the difference between a low, and a high signal. The cursors are set at the average value of the blue signal (5mV)


10b,11gWall power@150-255duty_Zoom_green_on.PNG